VPN Count Dashboard Example
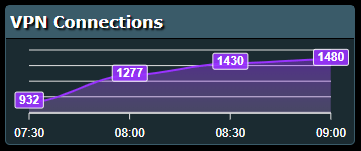
Before all hell broke loose I built a dashboard for management to give a near real-time view of health, errors, etc. Once we got sent home to work and we popped most of the work force on VPN, I was tasked with adding a widget to show connected users. Of course this is an example so it is stripped down but the full dashboard uses straight HTML5, JavaScript/JQuery, and Bootstrap 4. You don’t need JQuery to do the Ajax piece but I am used to it so it’s what I used. I also weighed using some framework like Vue JS but I wanted to keep it super simple. You may need to adjust for non-Chrome browsers.
The data collection side are a series of Python scripts and run via the Windows task scheduler. My Python scripts simply create JSON files that the AJAX calls pick up to update the gauges and widgets. To grab the VPN value I am using pySNMP module and talking to a Cisco device. This code should work on other devices.
Let’s take a look at the Python code. It returns an integer saving the history and JSON files with four 30 minute values ratated.
from pysnmp.hlapi import *
import os
import json
import datetime
import pickle

# Load and save incoming alert data.
def load_dat(path):
    data = {}
    if os.path.exists(path):
        try:
            with open(path,'rb') as stream:
                raw_data = stream.read()
                data = pickle.loads(raw_data)
        except:
            pass
    return data

def save_dat(path, raw_data):
    data = pickle.dumps(raw_data)
    with open(path,'wb') as stream:
        stream.write(data)
    return 1

def load_json(path):
    data = {}
    if os.path.exists(path):
        with open(path,'r') as stream:
            raw_data = stream.read()
            data = json.loads(raw_data)
    return data

def save_json(path, raw_data):
    data = json.dumps(raw_data)
    with open(path,'w') as stream:
        stream.write(data)
    return 1

def get_snmp_walk(host, port=161, community='public',
                  oids=['1.3.6.1.2.1.1.5.0','1.3.6.1.2.1.1.1.0']):
    """
    get_snmp_walk(host, port=161, community='public',
                    oids=['1.3.6.1.2.1.1.5.0','1.3.6.1.2.1.1.1.0'])

        PARAM: host (str)
        PARAM: port (int)
        PARAM: community (str)
        PARAM: oids (list)

        Yields tuple(str(mib), str(values))

        Walk MIBS from a list of OIDS.
    """
    errors = []
    results = {}
    for oid in oids:
        errorIndication, errorStatus, errorIndex, varBinds = next(
            getCmd(SnmpEngine(),
                   CommunityData(community, mpModel=0),
                   UdpTransportTarget((host, port)),
                   ContextData(),
                   ObjectType(ObjectIdentity(oid)),
                   )
        )
        if errorIndication:
            yield host, errorIndication
        elif errorStatus:
            yield host, errorStatus.prettyPrint()
        else:
            for varBind in varBinds:
                values = [x.prettyPrint() for x in varBind]

                if values[-1]:
                    field = values[0]
                    value = values[-1].encode('utf-8','ignore').decode()
                    yield field, value

# =============================================================================
# MAIN
# =============================================================================

if __name__=='__main__':

    hist_path = r'C:\htdocs\dashboard\json\history\vpn_counts.dat'
    json_path = r'C:\htdocs\dashboard\json\vpn_counts.json'
    curr_time = datetime.datetime.now().strftime('%H:%M')

    vpn_hist = load_dat(hist_path)
    if not vpn_hist:
        vpn_hist = {'hour':[],'total':[]}

    vpn_count = 0
    hosts=['ip_addr','ip_redun_addr'] # Cisco FW\VPN
    community='your_community_string'
    for host in hosts:
        for i in get_snmp_walk(host=host, community=community, oids=['.1.3.6.1.4.1.9.9.171.1.3.1.1.0']):
            vpn_count += int(i[-1])

    vpn_hist['hour'].append(curr_time)
    vpn_hist['total'].append(vpn_count)

    if len(vpn_hist['hour']) > 4: del(vpn_hist['hour'][0]) # 30 minute snap shots
    if len(vpn_hist['total']) > 4: del(vpn_hist['total'][0]) # 30 minute snap shots

    save_json(json_path, vpn_hist)
    save_dat(hist_path, vpn_hist)
For the web side you can add the three parts into a working HTML page. The HTML
<link rel="stylesheet" href="bootstrap-4.3.1-dist/css/bootstrap.min.css">
<link rel="stylesheet" href="bootstrap-4.3.1-dist/css/bootstrap-grid.min.css">

<script src="bootstrap-4.3.1-dist/js/bootstrap.min.js" type="text/javascript"></script>
<script src="bootstrap-4.3.1-dist/js/bootstrap.bundle.min.js" type="text/javascript"></script>
<script src="apexcharts.min.js"></script>

<!-- This is the actual widget container that holds the graph -->
<div class="" id="app_bottom_widget" style="background-color:#1b2b31;">
	<div class="card-headfoot-color bottom_widget_head">VPN Connections
	</div>
	<div class="card-body" style="padding:0; margin: 0px; text-shadow: none;">
		<div style="position:absolute; top: -49px; left: 2px; margin:0; padding:0; width: 350px;" id="daily_vpn_times"></div>
	</div>
</div>
The Style
<style>
#app_bottom_widget {
    width: 350px;
    height: 140px;
    border: 1px solid #3a5b69;
    border-radius: 5px 5px 5px 5px;
    margin: 0px 30px 15px 0px;
    padding: 0px;
    text-shadow: 2px 2px 2px #000000;
    float: left;
}

.bottom_widget_head {
	position:relative;
	margin:0;
	padding:4px;
	border-bottom:1px solid #000;
	font-size:12pt;
	font-weight:bold;
}
</style>
The JavaScript
<script>
	var vpnchart;

	function vpn_chart() {
		// Generate the actual graph object.
		var vpn_options = {
		   series: [{
				  data: [],
			  }],
		   chart: {
				  type: 'area',
				  //width: 290,
				  height: 135,
				  offsetY: 30,
				  offsetX: -1,
				  sparkline: {
					enabled: false,
				  },
				  toolbar: {
					 show: false,
				  },
			   },
			colors: ['#9933ff'], //Purple
			stroke: {
				show: true,
				curve: 'smooth',
				lineCap: 'round',
				colors: undefined,
				width: 2,
				dashArray: 0,
			},
			dataLabels: {
			  enabled: true
			},
			xaxis: {
			  categories: [],
			  labels: {
				style: {
					colors: ['#fff','#fff','#fff','#fff'],
				}
			  },
			},
			tooltip: {
			  enabled: false,
			}
		};

		vpnchart = new ApexCharts(document.querySelector("#daily_vpn_times"), vpn_options);
		vpnchart.render();
	}

	function vpn_counts() {
		// Poll JSON for data update.
		$.ajax({
			url: 'json/vpn_counts.json',
			type: "GET",
			dataType: "json",
			success: function (data) {
				vpnchart.updateOptions({
					series: [{
					  data: data.total
					}],
					xaxis: {
						categories: data.hour
					}
				});

			},
			error: function (xhr, status, error) {
				var err = JSON.parse(xhr.responseText);
				$('#messages').html('<h6>Dashboard Error</h6><p>'+err+'</p>');
			},
			cache: false
		});
	}

	// Kick it off.
    vpn_chart(); // Init. graph

    setInterval(function() {
        vpn_counts();
    }, 5000); // Update values if changed.
</script>
Pretty damned simple, looks great, portable, and super easy to maintain. Just be careful adding shit tons of setIntervals. Enjoy
If you are curious what the full dashboard looks like…
